Quantitative Measures of fixation distributions
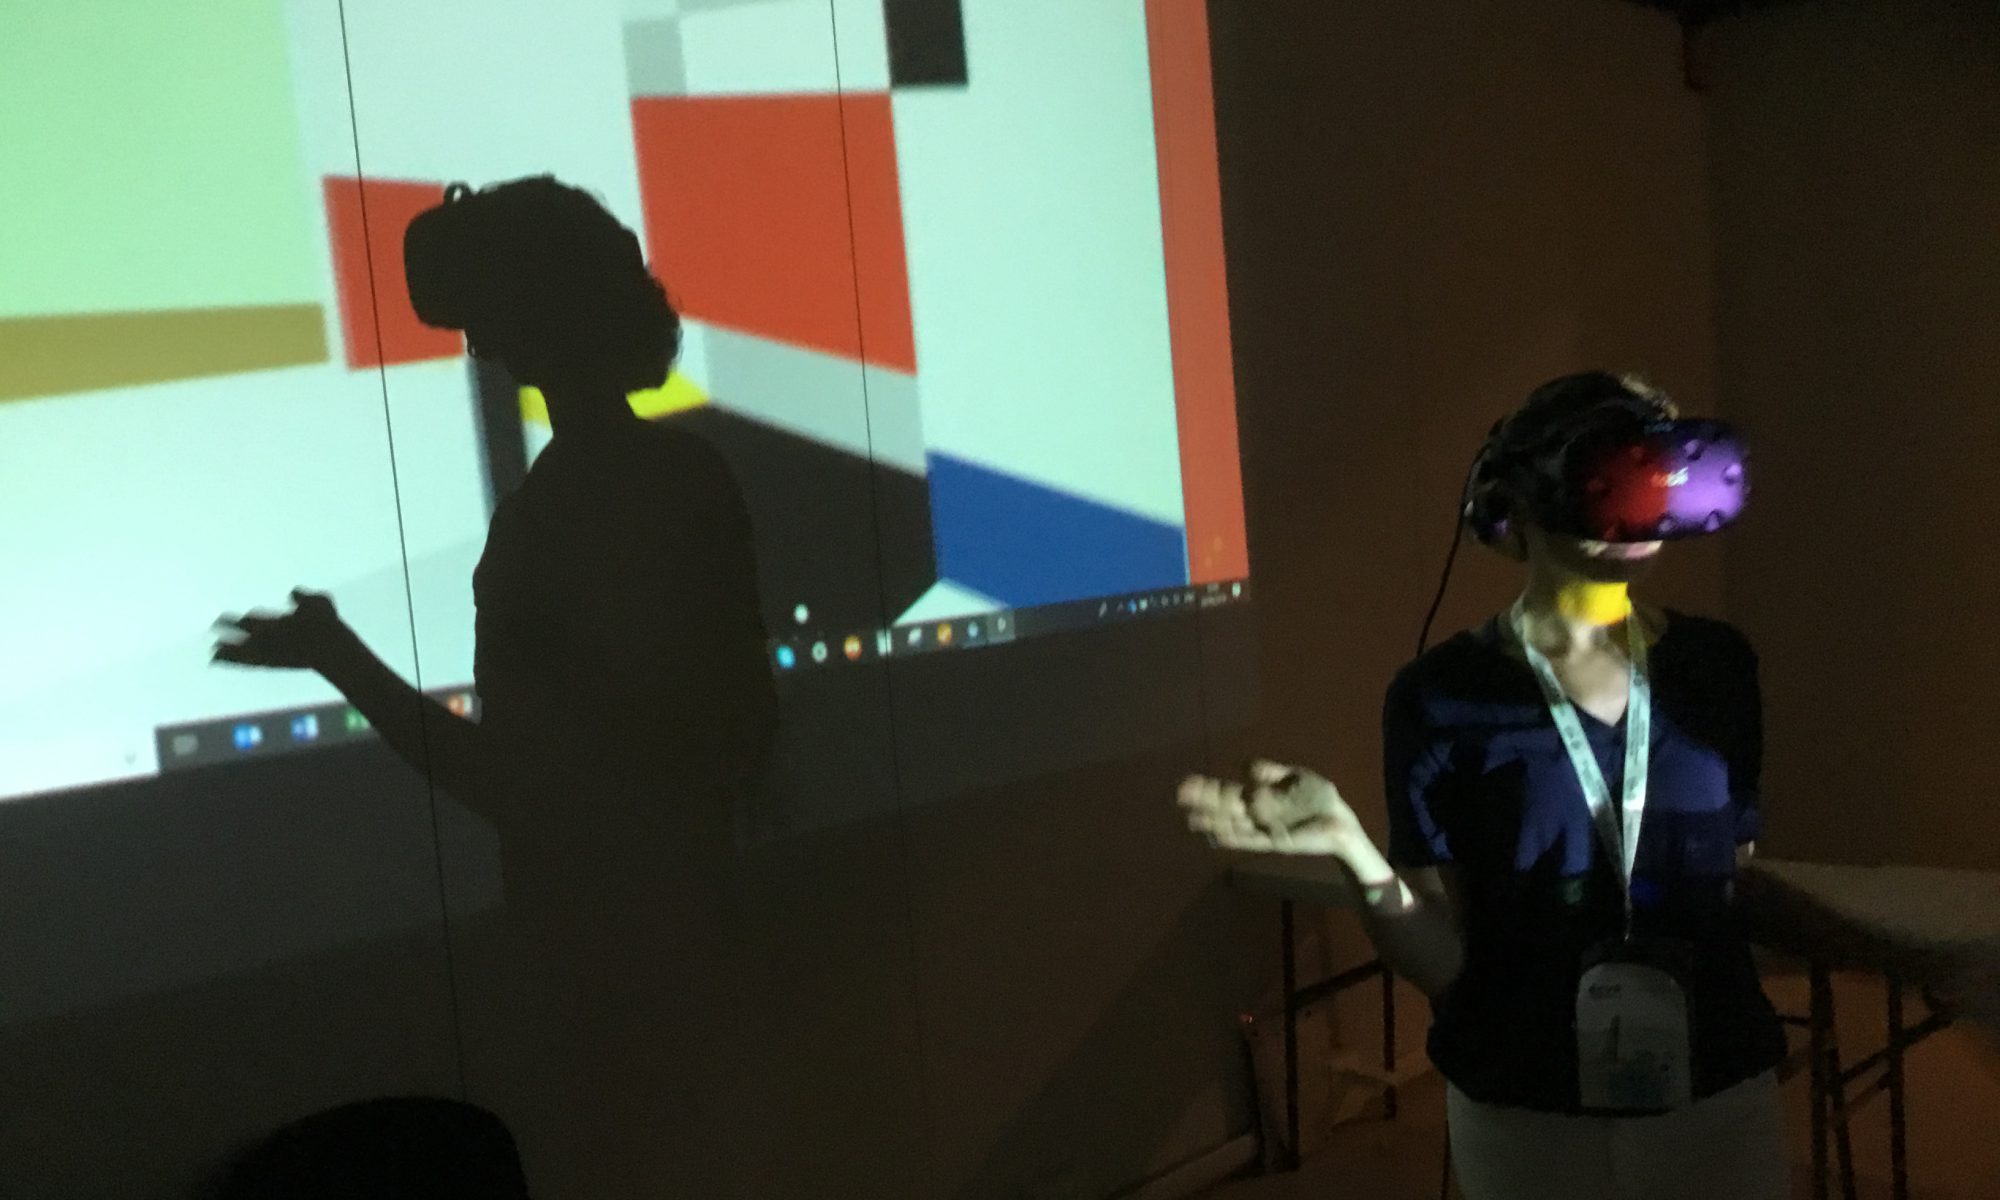
Using Tobii Pro VR Analytics, and ‘colliders’ defined in the 3D environment of the Mondrian room, enables us to quantitative analyse fixations that landed on walls, ceiling, floor, and particular sub-regions of interest – such as colour rectangles, outside world seen through the window, or pieces of furniture. This offline tool for quantitative analysis is a major step beyond online and offline visualisation techniques that opens up avenues to study human behaviour in VR with scientific depth and precision. Here, we benefit from contrasting fixation patterns when viewing Mondrian’s design in 2D vs. 3D, and we can isolate commonalities and individual differences in body, head and eye movements.
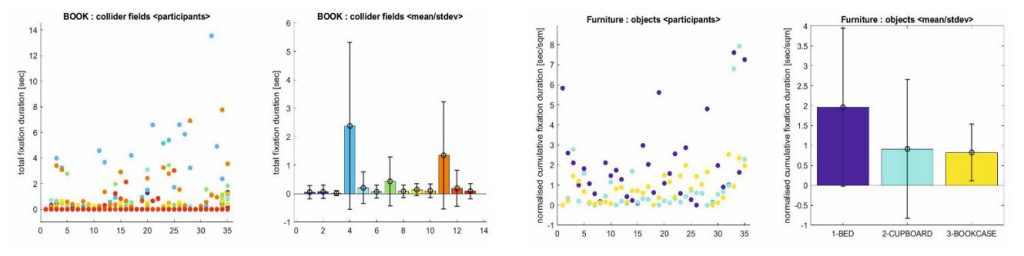
The illustration below shows preliminary analysis of fixation distributions from 35 participants tested during the ECVP 2018 demo night: the total duration of fixations are shown for the floor, ceiling, and four walls of the virtual Salon, and for the three pieces of furniture: bed, cupboard, and bookcase. There is a strong preference for the bed and little interest in the cupboard (NB: in view of the time of recordings, this finding might be little surprising, and could be interpreted in terms ‘utility/affordance’ rather than ‘aesthetic preference).