Visualisation of fixation patterns
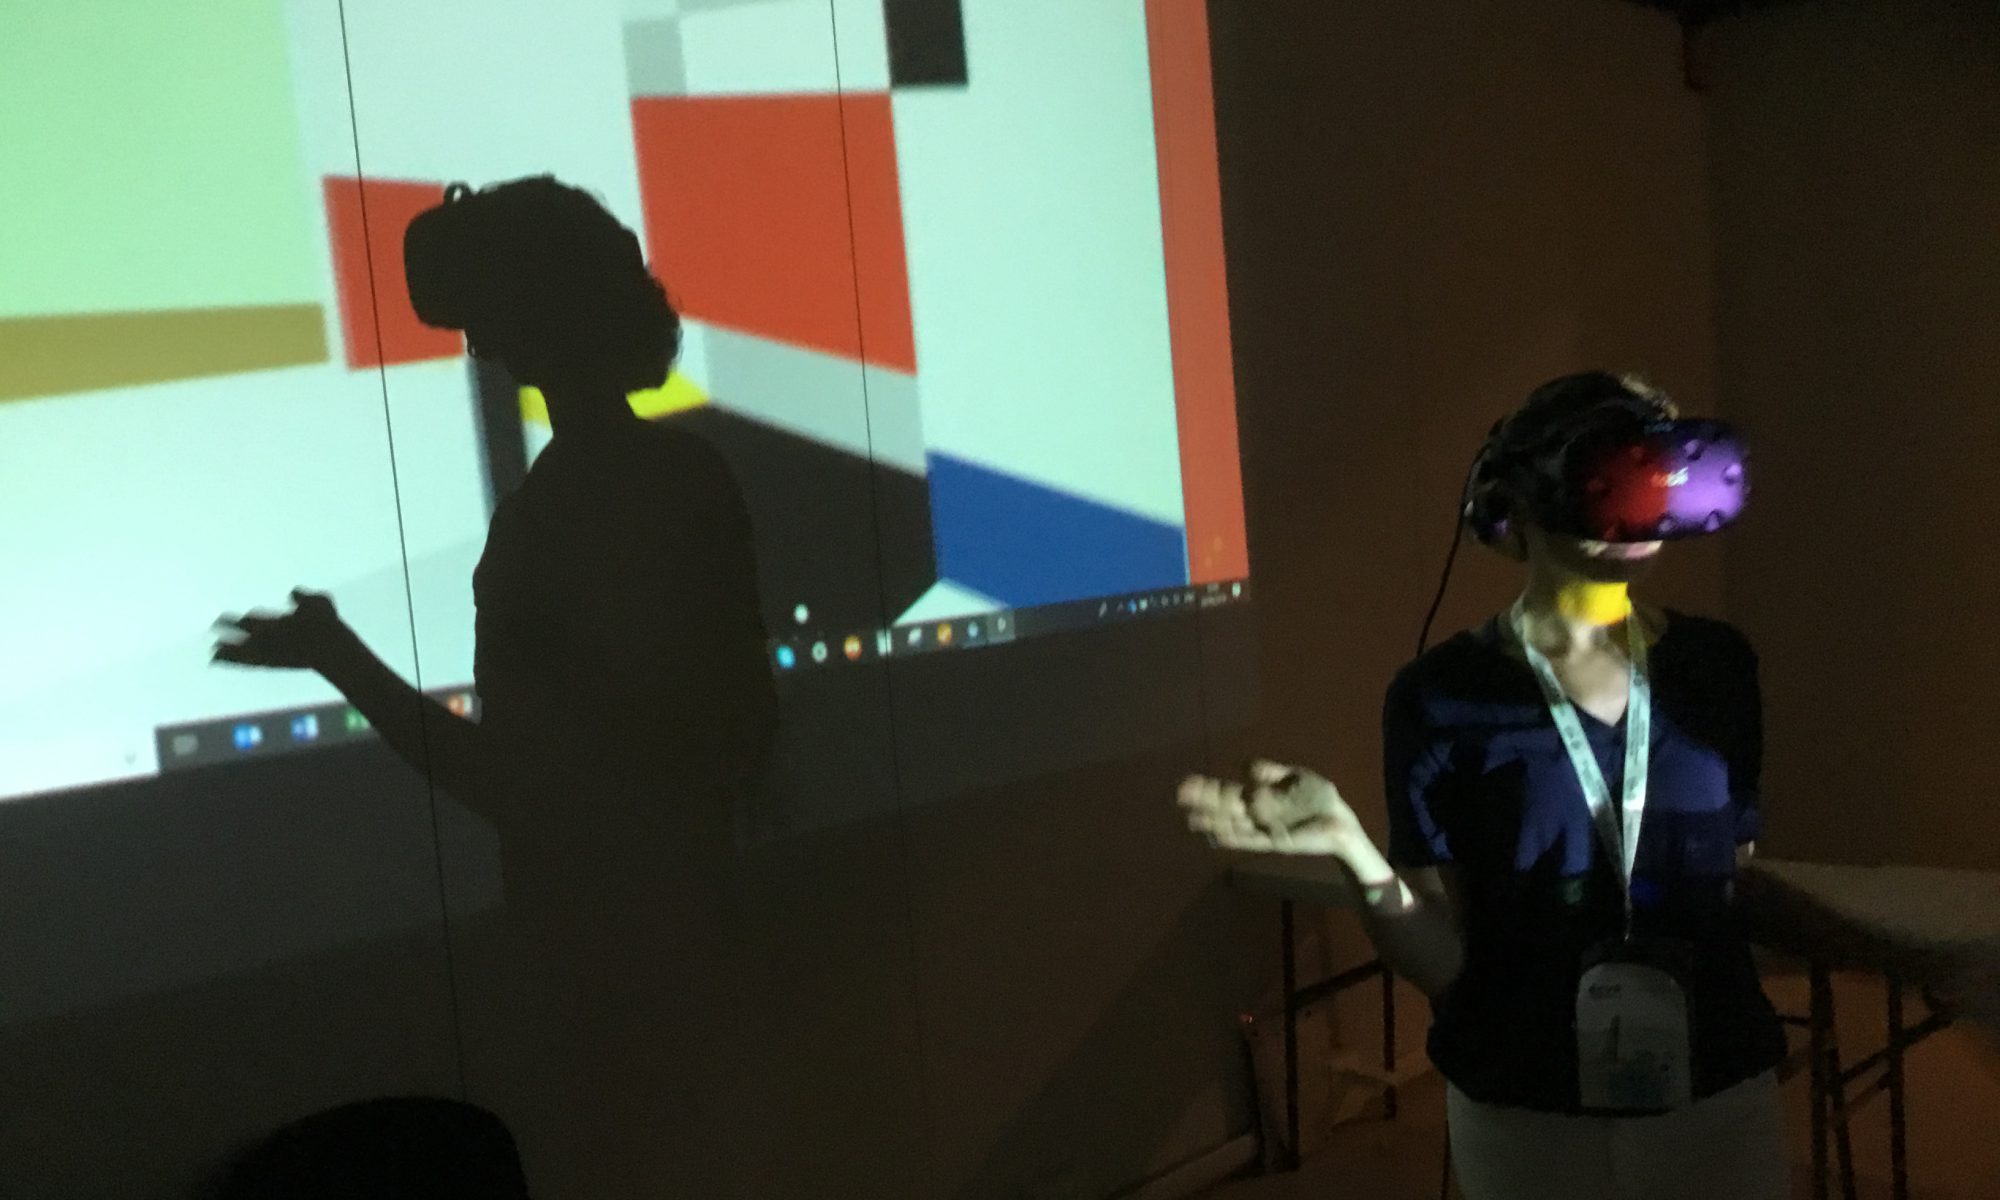
Here we present eye movement data recorded from 35 participants using Integration VR system. A first-person-view (FPV) with fixations was screened live on a large wall-mounted display (see illustration on home page). The online visualisation tool outputs a continuous stream of fixations and the fixations are accumulated over time for the current stream to generate heat maps (fixation density at any given location). This can also be back-projected on the 3D model of the Mondrian’s Salon, for a single or groups of observers at the same time for any chosen camera point in virtual space. Further software options allow to track participants’ location in the room, their head positions, and gaze directions.
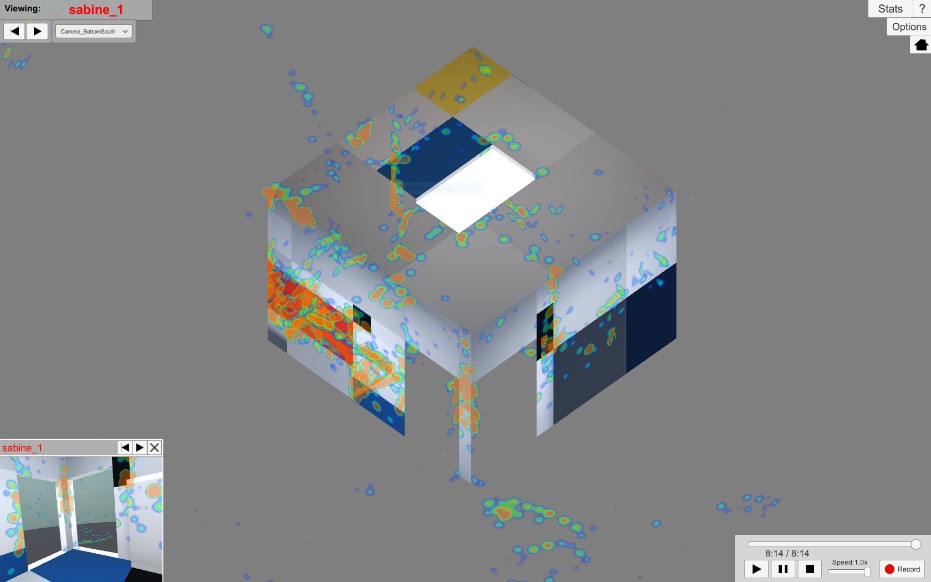
The integration VR system can be used off-line to generate retrospective versions of live feedback visualisations of individual and groups of observers. Most importantly, the system provides quantitative gaze data for three dimensional regions of interest (‘colliders’) which had been defined in the environment design: such as particular sub-regions on the walls covered with specific colour rectangles of prime aesthetic interest – or regions outside of the room which are looked through windows or doors. Altogether, a comprehensive description of participant’s behaviour during exploration of the virtual space is generated, and can be presented for a single or several observers at the same time.
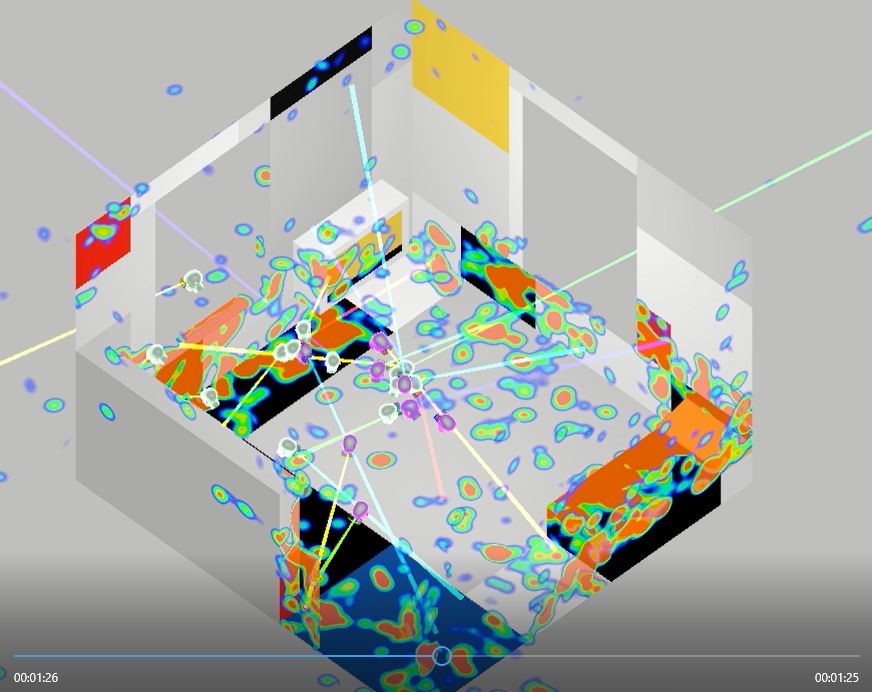
To watch a brief movie of the development of this fixation density map, click here